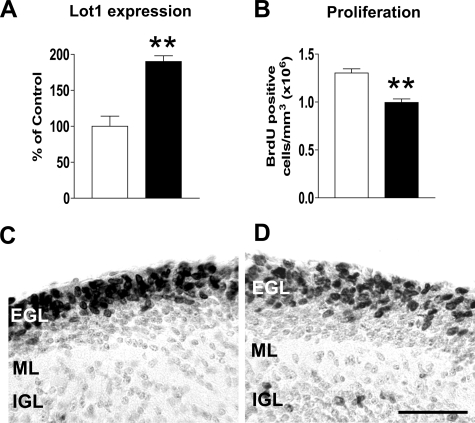
FIGURE 8.
Effect of PACAP on Lot1 expression and GCP proliferation in vivo. A, relative quantification by RT-qPCR of Lot1 expression in cerebellar extract from P7 rat pups untreated (n = 4) or treated (n = 4) with PACAP-38 (0.01 μg). Animals were scarified 6 h after a PACAP-38 intracranial injection. Data, given as % of control condition, are expressed as the mean ± S.E. B, quantification of BrdUrd-positive cells in the cerebellum of untreated (n = 4) and PACAP-treated rat pups (n = 4). These animals received one intraperitoneal BrdUrd injection 22 h after a PACAP-38 intracranial injection and were sacrificed after 2 h. BrdUrd-positive cells were counted in the EGL and were expressed as BrdUrd positive cells/mm3. Values are means ± S.E.; **, p < 0.01 (two-tailed t test). C and D, photomicrographs of sagittal sections across the cerebellum of a P7 untreated (C) and PACAP-38 (0.01 μg) treated rat (D). Sections were taken at the level of the midline. These animals received one BrdUrd injection 22 h after a PACAP-38 intracranial injection and were sacrificed after 2 h. Sections were immunostained for BrdUrd and counterstained with toluidine blue. Scale bar, 100 μm. IGL, inner granular layer; ML, molecular layer.

