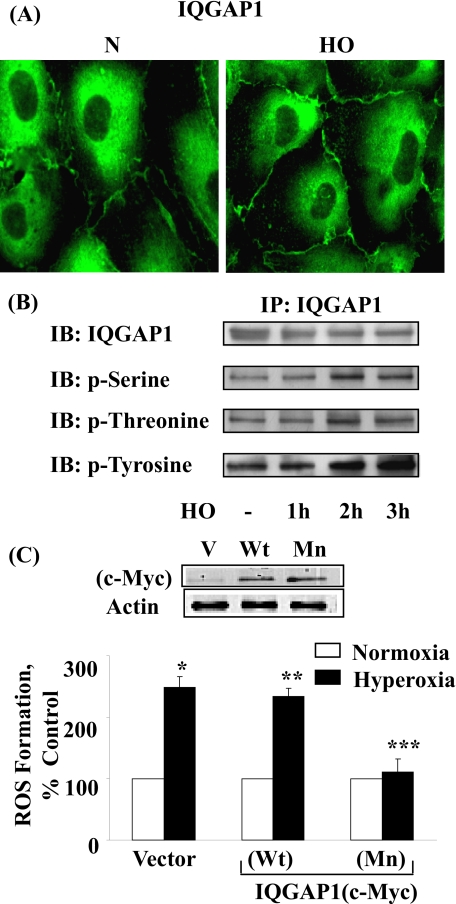
FIGURE 5.
Involvement of IQGAP1 in hyperoxia-induced ROS formation. A, HPAECs were exposed to either normoxia or hyperoxia (3 h), probed with anti-IQGAP1 antibody, and redistribution was examined by immunofluorescence microscopy using a ×60 oil objective as described under “Experimental Procedures.” Hyperoxia induced the translocation of IQGAP1 to the cell periphery and in structures resembling membrane ruffles. Shown is an immunofluorescence micrograph from three independent experiments. B, HPAECs were exposed to either normoxia or hyperoxia (1, 2, and 3 h). Cell lysates were immunoprecipitated using anti-IQGAP1 antibody, separated by 10% SDS-PAGE, and Western blotted with antibodies as indicated. Shown is a representative blot from three independent experiments. C, HPAECs were transfected with vector control or Myc-tagged IQGAP1 wild-type (Wt) or mutant (Mn), loaded with 10 μm DCFDA, exposed to either normoxia or hyperoxia (3 h), and ROS formation was quantified by DCFDA fluorescence as described under “Experimental Procedures.” Values are mean ± S.D. from three independent experiments in triplicate. *, p < 0.01 compared with vector control/normoxia; **, p > 0.05 compared with vector control/hyperoxia; ***, p < 0.05 compared with vector control/hyperoxia. In the inset, overexpression of IQGAP1 Wt or Mn was verified by Western blotting of cell lysates (20 μg of protein) and probed with anti-Myc antibody.

