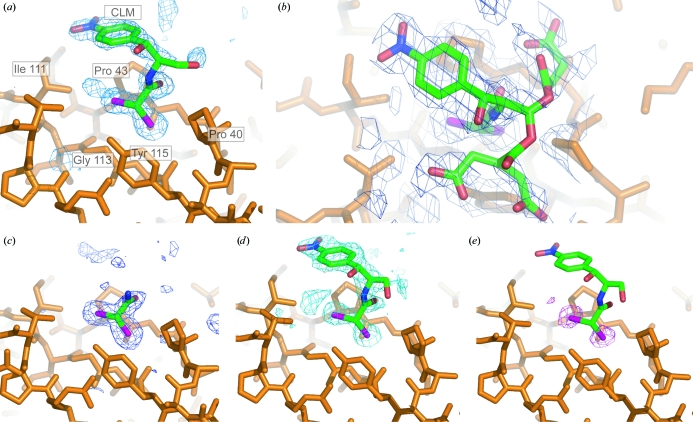
Figure 2.
The physiological ligand-binding site. (a, b, c) Maps and models for chloramphenicol succinate: the refined model of CLS is shown [with the succinate tail ini (b) and without it in (a)]. (a) Unbiased F o − F c map (data set DraE–CLS.2) contoured at 2.5σ showing the CLS density in the hydrophobic pocket (P3 crystal form). (b) The NCS-averaged 2F o − F c electron density in the binding pocket (P3 crystal form, averaged over all six copies of the density in the ASU) reveals three possible lowest energy conformers for the succinate tail. (c) Unbiased F o − F c map (blue mesh, data set DraE–CLS.1) contoured at 2.3σ, showing that in the C2 crystal form the aromatic head group and the succinate tail are disordered. (d) The same view as in (a) for the BRM derivative, with the unbiased F o − F c difference map (contoured at 2.2σ) shown as a blue mesh. (e) Anomalous difference map (purple mesh) for the BRM derivative calculated in the resolution range 25–1.9 Å using phases from the protein model only (contoured at 3.5σ). It clearly reveals the presence of two bromines in the CLM-binding site. The final refined BRM model (20% occupancy) is also shown. The final refined CLS model is not shown for reasons of clarity, but it adopts an identical conformation. Figures were rendered in PyMOL (DeLano, 2004 ▶).

