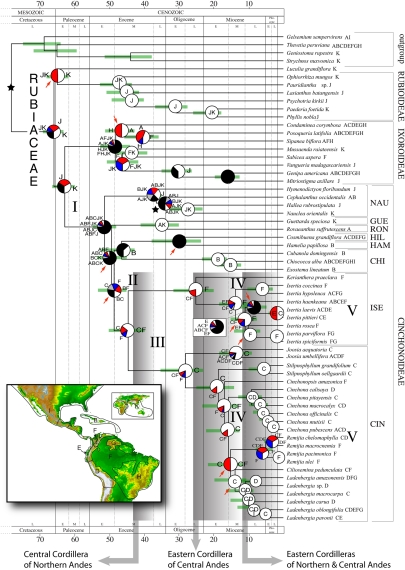
Fig. 1.
Combined chronogram and biogeographic analysis of Neotropical Rubiaceae. The tree is the 50% majority-rule consensus (with compatible groups added) from the Bayesian analysis, with branches proportional to absolute ages (in millions of years) calculated from mean branch lengths of 6,000 Bayesian trees. Green bars indicate 95% confidence intervals of node ages estimated from 1,000 trees randomly sampled from the Bayesian stationary distribution. Node charts show the relative probabilities of alternative ancestral distributions obtained by integrating dispersal-vicariance analysis (DIVA) optimizations over the 1,000 Bayesian trees; the first 4 areas with highest probability are colored according to their relative probability in the following order: white > red > blue > gray; any remaining areas (usually frequencies <0.01) are collectively given with black color. Stars indicate calibration points. Red arrows indicate clades with a posterior probability <0.90. Present ranges for each species are given after the species name. Brackets identify subfamilies and tribes: CHI, Chiococceae; CIN, Cinchoneae; GUE, Guettardeae; HAM, Hamelieae; HIL, Hillieae; ISE, Isertieae; NAU, Naucleeae; RON, Rondeletieae. Shaded boxes indicate approximate periods of Andean uplift phases. The biogeographic interpretation of events I–V is summarized in Fig. 2. (Inset) Areas used in the biogeographic analysis. A, Central America, B, West Indies; C, Northern Andes; D, Central Andes; E, Chocó; F, Amazonia; G, The Guiana Shield; H, Southeastern South America; I, Temperate North America; J, Africa; K, Australasia. Topographic map from the National Geophysical Data Center (www.ngdc.noaa.gov).

