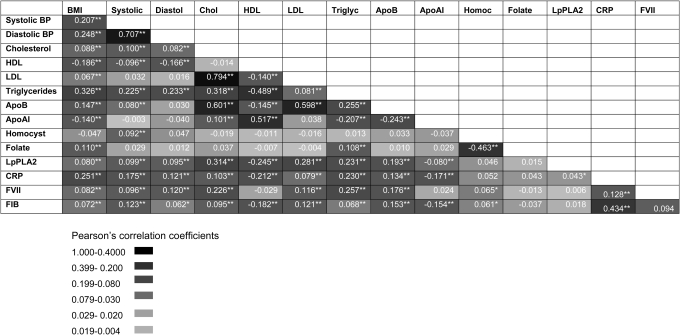
Figure 1.
Correlations between multiple phenotypes linked to CHD in 2775 men from the NPHSII study. Values in cells indicate Pearson's correlation coefficient R. *P < 0.01, **P < 0.001 (see colour code). Baseline and five repeat measures were available for cholesterol, triglycerides (TG), coagulation factor VII (FVIIc), fibrinogen, blood pressure (BP), smoking and body mass index (BMI) and single measures for the remaining traits.

