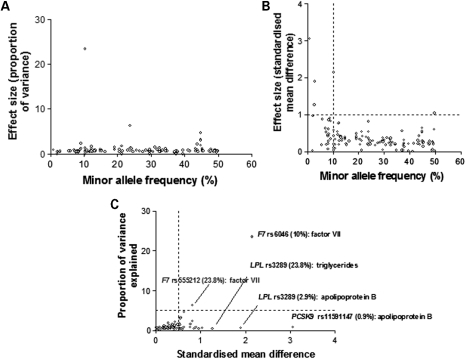
Figure 3.
The relationship between minor allele frequency and effect size for SNP-phenotype associations exceeding the pre-specified FDR threshold. Effect size was expressed as: (A) variance and (B) as the standardized mean difference for comparisons of homozygous subjects. (C) Examples of SNPs with extreme effects assessed in terms of standardized mean difference.

