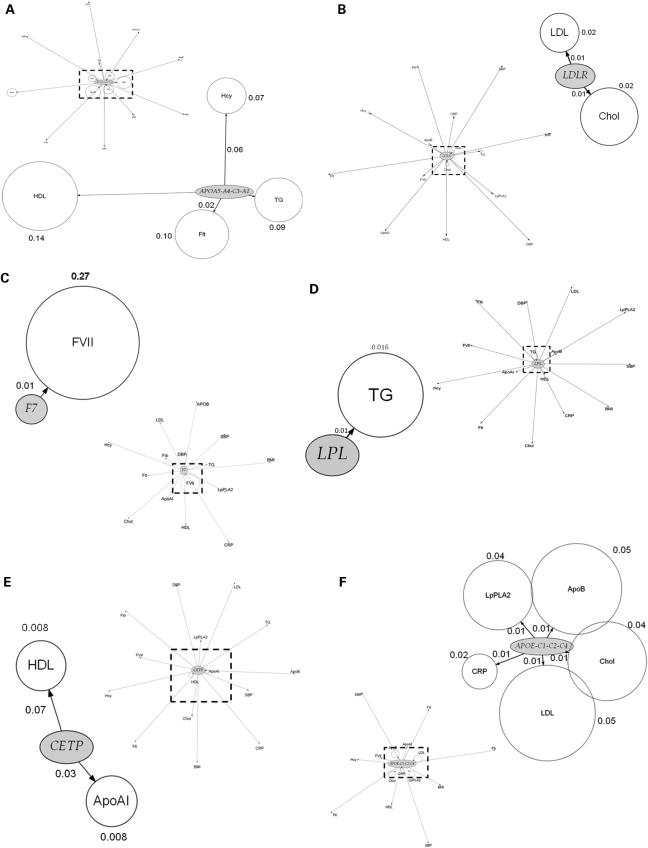
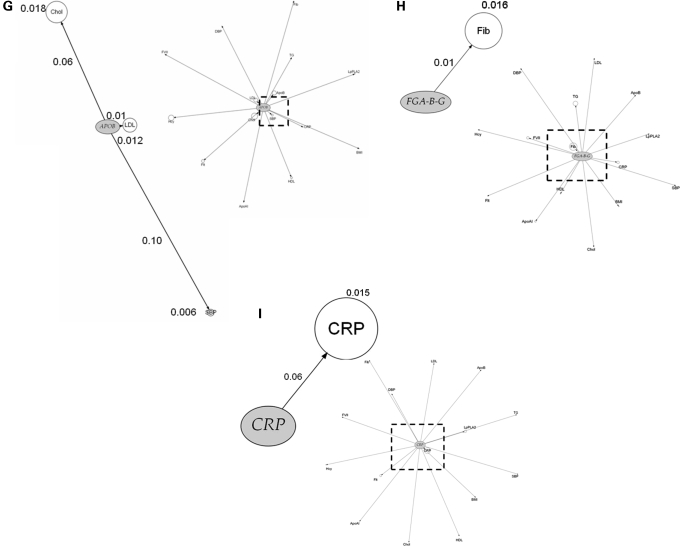
Figure 4.
Phenome plots. The gene of interest is depicted as an ellipse and the associated phenotypes traits as circles. The circle diameter is a measure of the variance of the phenotype explained by the variance of the genotypes (R2) of all the SNPs in the gene of interest. The numbers given next to each phenotype are the percent values of the coefficient of determination R2 of the phenotype for the combined effect of all the SNPs of the gene. The distance from the gene to each phenotype is a measure of the significance value, adjusted for multiple testing using the FDR, for the SNP with the strongest signal within the gene of interest. The number shown next to each edge is the percent value of the FDR adjusted P-value with its length measured from ellipse (gene) centre to circle (phenotype) centre. The dashed line represents those phenotypes which fall within the <0.1 FDR with the gene of interest. Those phenotypes and the gene are then expanded alongside in the accompanying figure so that details can be seen more clearly. For the phenome scan, an even more stringent FDR adjusted P-value of <0.1 to reduce further the risk of false-positive association. (Hcy, homocysteine; Flt, folate; SBP, systolic blood pressure; DBP, diastolic blood pressure; BMI, body mass index).


