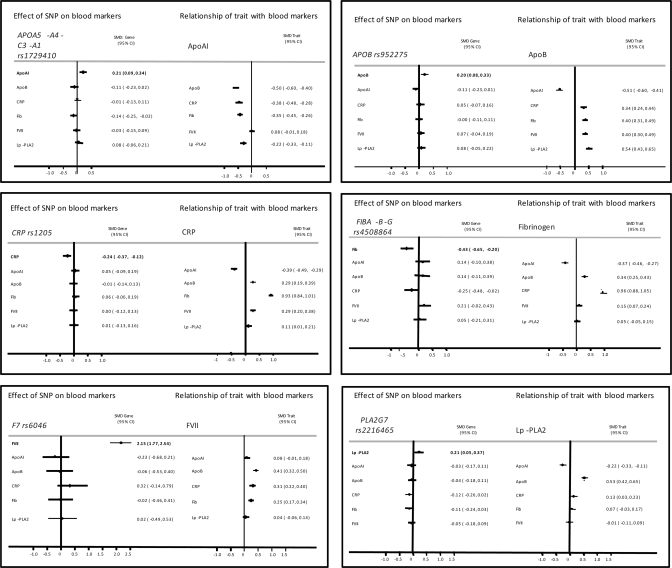
Figure 5.
The magnitude of the association between protein phenotypes is illustrated as the mean difference of the standardized levels of the phenotype between top and bottom tertile of the index phenotype, approximately equal to a 2 SD difference. When the most strongly associating SNP in the pQTGs is considered, the mean difference is between the two homozygote groups. (A) apoAI, (B) apoB, (C) CRP, (D) coagulation factor VII, (E) fibrinogen, and (F) Lp-PLA2.

