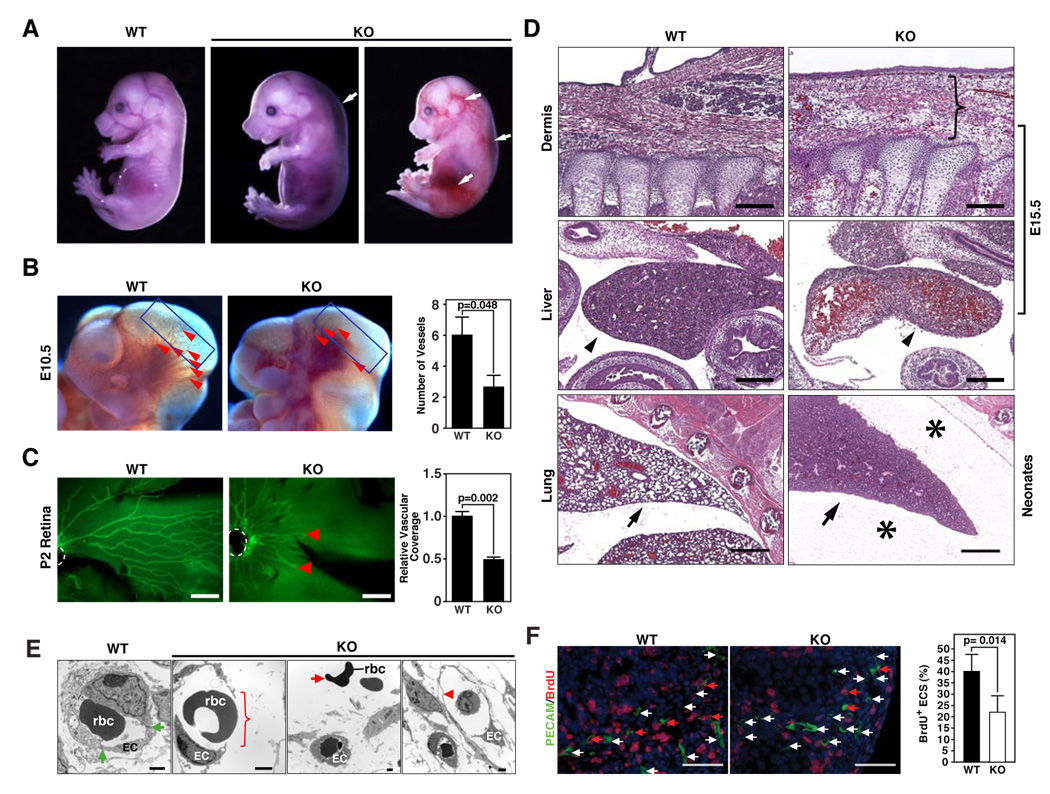
Figure 4. Vascular abnormalities in miR-126 null mice.
(A) Wild-type (WT) and miR-126−/− (KO) embryos at E15.5. A subset of KO embryos shows systemic edema and hemorrhages as indicated by the arrows.
(B) Lateral views of cranial regions of WT and miR-126 KO embryos at E10.5. Superficial cranial vessels, shown by arrowheads, are apparent in WT embryos, but are severely deficient in the mutant. The number of vessels in the cranial region indicated by boxes, is shown on the right (n=6).
(C) Vascularization of the retina at P2, as visualized by PECAM staining. The position of the central retinal artery is demarcated by dashed white lines and the termini of retinal vessels in the mutant by red arrows. Bar = 200 um. Relative vascular coverage is shown on the right (n=3).
(D) H&E staining of sagittal sections of the dermis and liver of E15.5 embryos and lung of neonates of the indicated genotypes. Scale bar in the upper and middle panel equals 200um, and scale bar in the bottom panel equals 500um. The bracket indicates the thickening of dermis with erythrocytes and inflammatory cells in the tissue space in the KO embryo. The arrowheads indicate congestion of red blood cells in KO liver compared to the WT liver. The arrows point to the lungs, in which the alveoli fail to inflate in the KO mice. Asterisks show edema in the thoracic cavity in KO neonates.
(E) Electron microscopy of capillaries in WT and KO embryos at E15.5. The bracket shows the breakdown of vessels in KO embryos. The green arrows point to tight junctions in WT endothelial cells. The red arrow points to the red blood cells floating outside of the vessels in KO embryos, while the arrow head indicates the thinning of the endothelial layer in the vessel of KO embryo. EC: endothelial cell; rbc: red blood cell.
(F) Endothelial cell proliferation in E15.5 KO embryos. Significantly less BrdU (red) and PECAM1 (green) double positive cells were observed in KO compared to WT embryos. The red arrow points to the PECAM/BrdU double positive cells, while the white arrow points to the PECAM single positive cells. Nuclei were stained with DAPI (blue). The statistics are shown on the bar graph (p=0.014).

