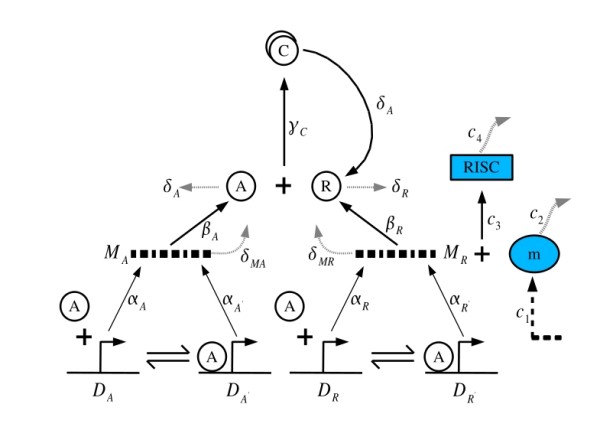
Figure 1.

Biochemical network of the extended circadian oscillator model (Model A) with miRNA regulation at the post-transcriptional level. DA' and DA denote the number of activator genes with and without A bound to its promoter respectively, and DR', DR refer to the repressor gene driven by the common promoter A. MA, MR denote the mRNA corresponding to the activator A and the repressor R. C corresponds to the inactivated complexes formed by A and R with binding rate γc. The constants α (αA and αR) and α' (αA' and αR') denote the basal and activated rates of transcription, β (βA and βR) the rates of translation, δ (δA and δR) the rates of spontaneous degradation. The details of the reaction rate values are given in [18]. The miRNA m combines with MR to form the RISC CRISC. c1 is the rate of production of miRNA, c2 is its decay rate. c3 is the rate at which miRNA combines with R and c4 is rate at which RISC degrades. Throughout the volume is assumed to be unity. The cellular volume is assumed to be the unity so that concentrations and number of molecules are equivalent. It is assumed that the complex breaks into R because of the degradation of A and, therefore, the parameter δA appears twice in the model.
