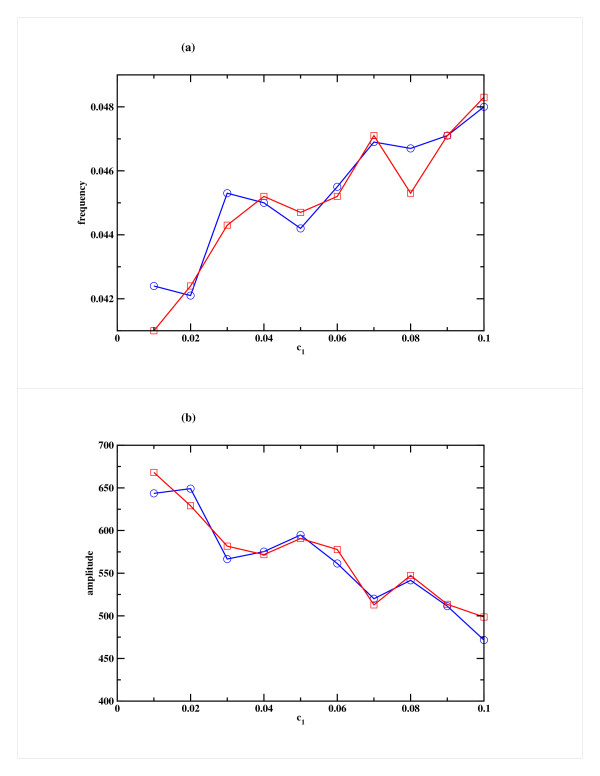
Figure 10.
Effect of variation of the miRNA production rate (c1) on the PER protein for Model B. Variation of (a) the frequency and (b) the amplitude of oscillation in the PER protein as a function of c1, the rate of miRNA production. Cases 1 and 2 are shown in blue and red respectively. The other parameters, namely the rate of binding of miRNA to mRNA (c3) and RISC degradation rate (c4) are kept fixed at 0.02 h-1 and 0.001 h-1 respectively.

