Figure 2.
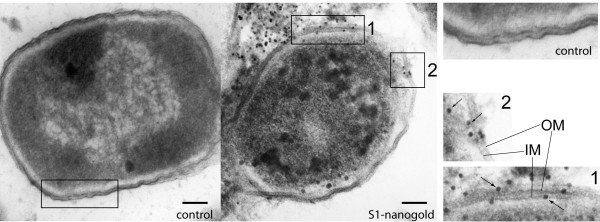
Electron microscopy of S1 nanoparticles on Escherichia coli. Transmission electron microscopy micrograph of E. coli with negS1 (left) or S1-nanogold conjugate (middle). An ultrathin section of a cell incubated with 1 μM negS1- or S1-nanogold conjugate, fixed with paraformaldehyde, glutaraldehyde and osmium tetroxide. The right panel shows 2× magnified details. The 'control' shows a membrane section of negS1-nanogold, whereas (1) and (2) are details of S1-nanogold. Nanogold particles, identified as electron-dense black spots (arrows), can only be found in samples containing S1-nanogold particles and are distributed on the outer and inner leaflets of both membranes, as well as in the periplasm and cytoplasm. OM: Outer membrane, IM: Inner membrane. Scale bar: 100 nm.

