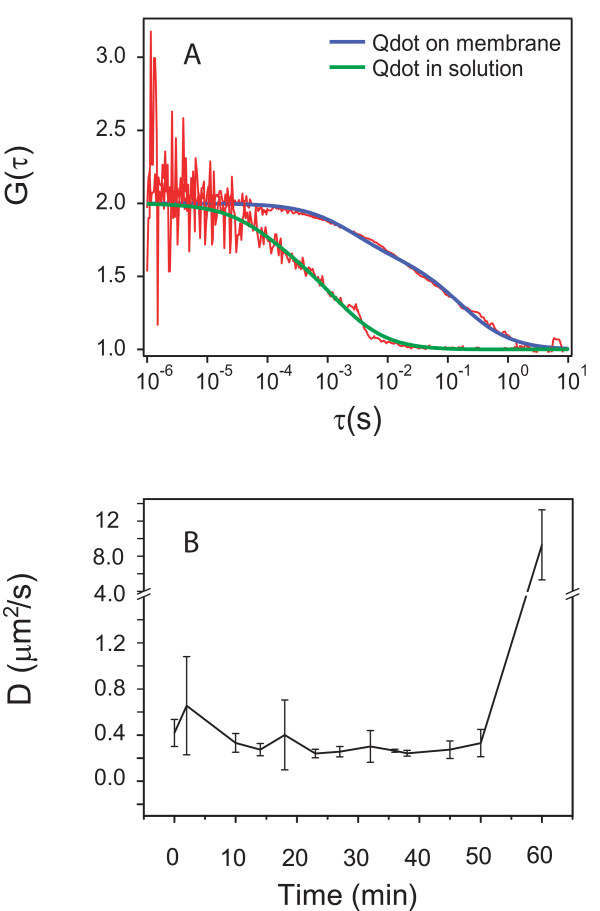
Figure 4.
S1-Qdot conjugate movement defined by fluorescence correlation spectroscopy. (A) Autocorrelation function of S1-Qdot conjugate on bacterial membrane (blue curve) and free in solution (green). Concentration of S1-Qdot conjugate was 100 nM. The diffusion coefficient was between D = 4.96 × 10⁻³ μm2/s and 0.159 × μm2/s. (B)Diffusion of the S1-Qdot conjugate on the membrane over time at a total concentration of S1 of 500 nM.

