Figure 1.
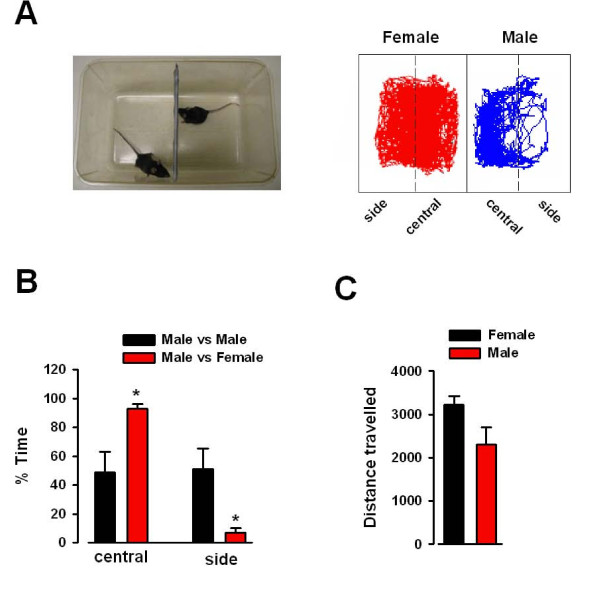
Behavioral test for sexual attraction. (A) Photograph and diagram of the sexual attraction test. The two boxes are further divided into side and central zones as indicated by the dashed line. Representative traces showing the movement of the male and female mice for 30 min. Left = female (red); right = male (blue). (B) Male mice (n = 5) spent significantly more time in the central zone than in the side zone (male vs. female) (n = 5), while there is no difference in the time spent in either zone in male vs. male test. * P = 0.007. (C) There is no difference in the total distance traveled between male and female mice in the sexual attraction test.

