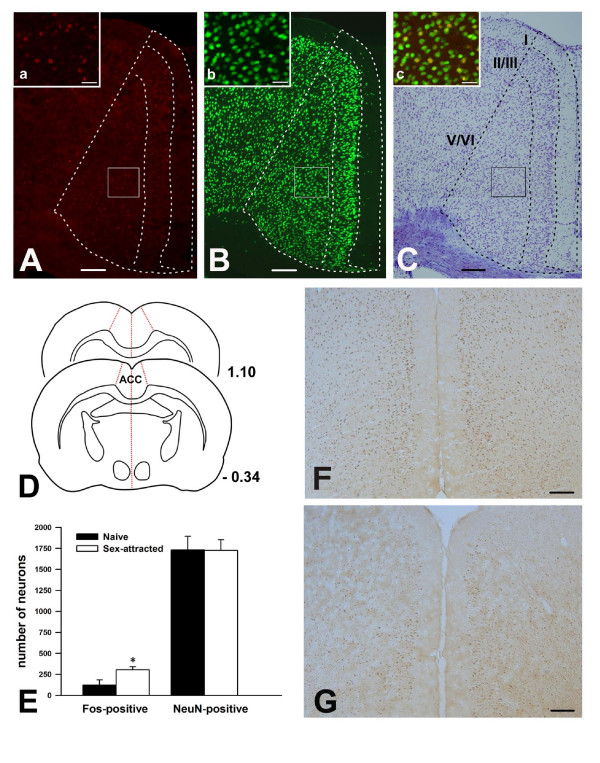
Figure 2.
Sexual attraction activated Fos expression in the ACC neurons in male mice. (A) Fos immunostaining in the ACC after sexual attraction. The framed area is magnified in (a). (B) NeuN immunostaining in the ACC. The framed area is magnified in (b). (C) The same section as shown by (A, B), was counterstained by Nissl technique; demarcation for neuronal layers in the ACC. The inset (c) is the overlapping of (a) and (b). Yellow color in (c) represents the Fos/NeuN double-labeled neurons. (D) Diagram showing the ACC from Bregma -0.34 to 1.1, where the Fos-positive and NeuN positive cells were counted. (E) Bar graph showing the significant increase of Fos neurons in layer II/III and ACC after sexual attraction test compared to naïve mice. (F and G) The representative slices with Fos staining between sex-attracted group (F) and naïve mice (G). The increased Fos expression was found in layer II/III and layer V/VI. Bar = 150 μm in A – C, F and G; and 35 μm in a – c.

