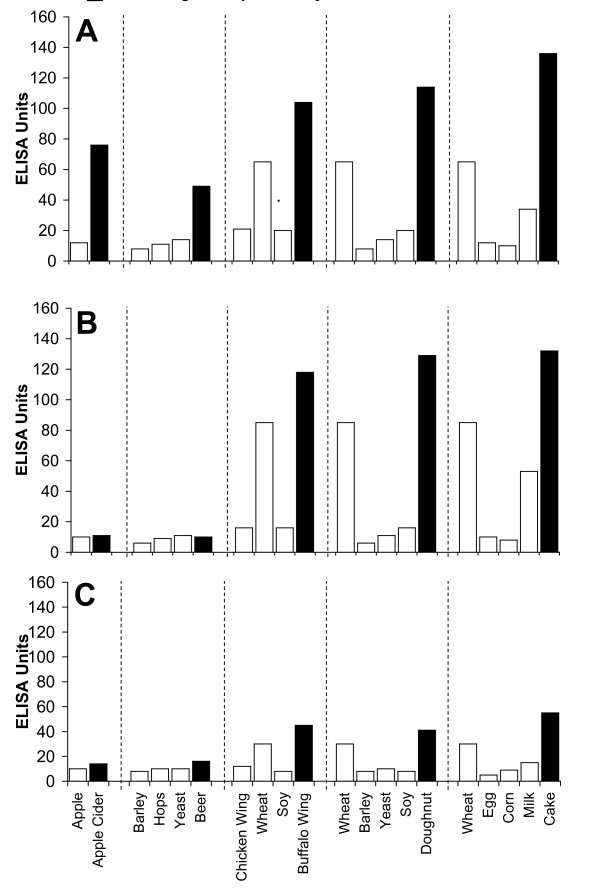
Figure 2.
Serum Levels of IgG (A), IgA (B), and IgM (C) against Raw (white square) vs Processed (black square) Food Antigens Expressed by ELISA Units. Measurement of IgG, IgA and IgM antibodies against different raw or crude ingredients versus the processed or cooked versions of specific foods in the serum of a patient with high reactivity.

