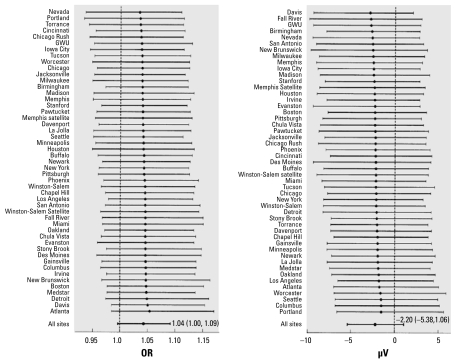
Figure 1.
Multivariable-adjusted ORs for ST–T abnormality and changes in T amplitude (μV) in lead V3 (95% CI) per 10-μg/m3 increase in lag0–2 PM2.5, by exam site. We based estimates on Bayesian hierarchical regression models adjusted for demographic, clinical, and weather variables: age; race/ethnicity; education; BMI; current smoking status; history of CHD, diabetes, hypertension, SBP, chronic lung disease, or hypercholesterolemia; season; day of week; time of day; temperature; dew point; and pressure.

