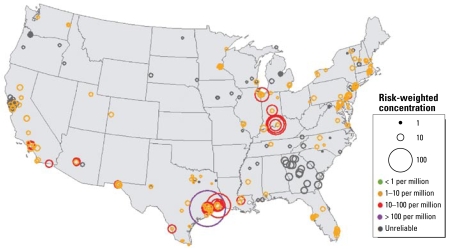
Figure 5.
Risk-weighted concentrations of 1,3-butadiene (per million) at coterminous U.S. sites between 2003 and 2005. Circled areas indicate the magnitude of risk associated with each site. Gray circles indicate sites with poorly characterized concentrations and should be considered as upper-limit estimates.

