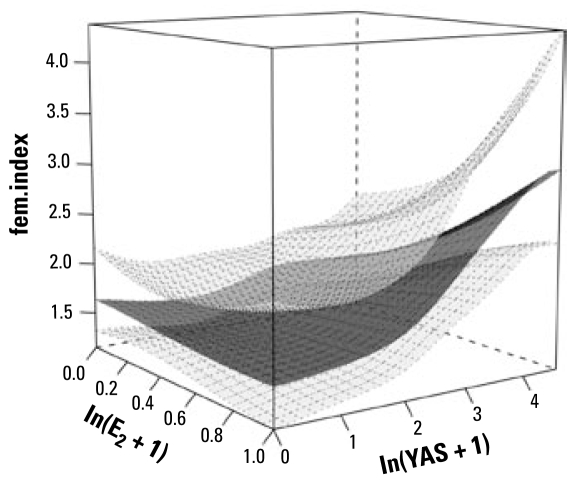
Figure 5.
Surface plot illustrating the results of the statistical modeling of the association between exposure to E2 and anti-YAS on the feminization index in intersex fish. The lower and upper surfaces represent 95% confidence limits and the middle surface is the fitted mean. The plot indicates a somewhat nonadditive effect of E2 and anti-YAS on the fem.index. This was confirmed by a significant negative E2 × anti-YAS interaction term (p = 0.02) in the logistic regression model.

