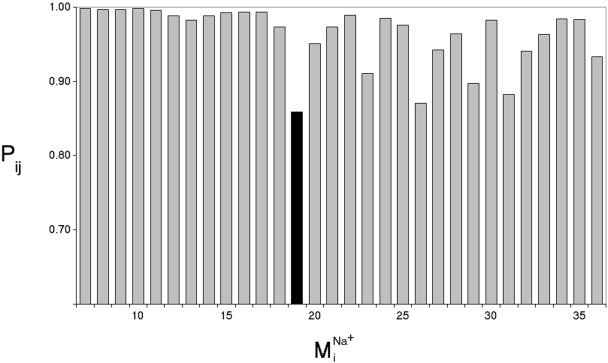
Fig. 5.
Divergence in sodium-bound normal modes
 from the null
spectrum,
  ,
calculated from the normal mode analysis of the control (no sodium in binding
site) system. Dot product squares were computed for each sodium-bound normal
mode vector against modes within a window of the null spectrum centered at the
most analogous mode
 (highest dot
product with
  ).
Each dot product square is then summed over the entire null spectrum window to
provide a Pij value
(
 ).
Plotted here is Pij for each normal mode
 , calculated over
a window size of seven null modes. Among the lowest frequency nontrivial
normal modes (7–36, ranked in increasing frequency),
 is the lowest frequency
and most divergent (lowest Pij) mode from the null system as it is
not reproduced by a set of normal modes from the null system. A similar trend
in Pij values is obtained regardless of the window size used in the
Pij calculation.

