
TABLE 1.
Affinity of D4-selective ligands for the wild-type D2 and D2-V2.61(91)F mutant receptors expressed in COS-7 cells Affinities for the wild-type D4 receptor are shown for comparison. Affinity values (Ki or KD, nanomolar) are expressed as geometric averages of the mean of three experiments ± S.D. The fold changes in affinity values relative to the wild-type D2 (D2-WT) are shown in parentheses with the direction of the change indicated by arrows: ↑, increase in Ki value corresponding to a decreased affinity; and ↓, decrease in Ki value corresponding to an increased affinity.
| Ligand | Structure | D2-WT | D2-V2.61(91)F | D4-WT |
|---|---|---|---|---|
| L-745,870 (CPPMA) |  |
656 ± 227 (1) | 482 ± 251 (↓ 1.4) | 0.32 ± 0.14 (↓ 2050) |
| L-750,667c |  |
1400 ± 950 (1) | 1100 ± 510 (↓ 1.3) | 0.11 ± 0.02a (↓ 13,400) |
| RBI-257 | 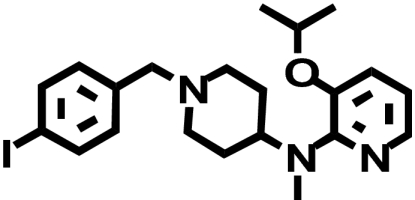 |
85 ± 12 (1) | 78 ± 3.3 (↑ 1.1) | 0.27 ± 0.10b (↓ 315) |
| FAUC213c |  |
1300 ± 640 (1) | 1200 ± 730 (↓ 1.1) | 1.1 ± 0.22b (↓ 1030) |
| Ro61-6270 | 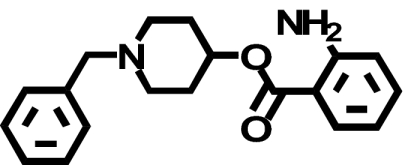 |
655 ± 274 (1) | 1121 ± 70* (↑ 1.7) | 0.89 ± 0.12b (↓ 736) |
| NGD 94-1 | 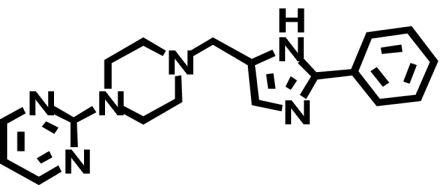 |
817 ± 284 (1) | 3358 ± 266* (↑ 3.3) | 0.3 ± 0.04b (↓ 2720) |
| PD168,077 | 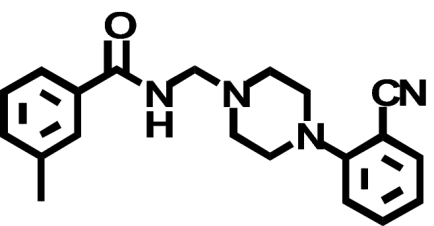 |
1380 ± 64 (1) | 3601 ± 474*(↑ 2.6) | 1.5 ± 0.41b (↓ 540) |
| (—)-Quinpirole | 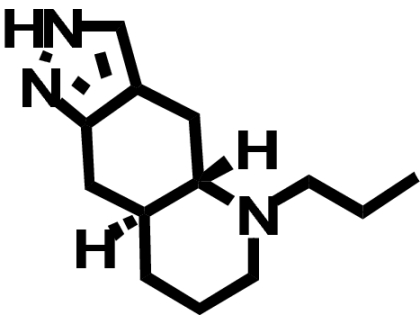 |
812 ± 617 (1) | 673 ± 466 (↓ 1.2) | N.D. |
| [3H]Methylspiperone | 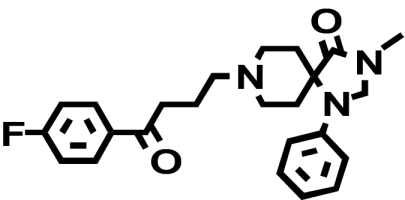 |
0.016 ± 0.0032 (1) | 0.066 ± 0.030* (↑ 4.1) | 0.29 ± 0.030a (↑ 18) |