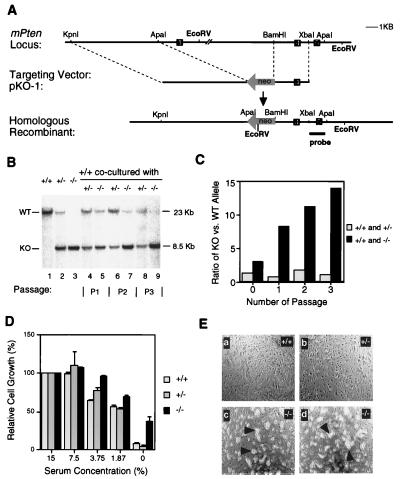
Figure 1.
Inactivation of the mouse Pten gene and the growth properties of Pten−/− ES cells. (A) A restriction map of the genomic region containing the Pten gene is shown at the top, with exons depicted. The targeting vector pKO-1 is shown in the middle. A restriction map of the predicted recombinant harboring the deleted allele is shown at the bottom. (B) Southern blot analysis. Lanes 1–3: DNA from Pten+/+ (+/+, lane 1), heterozygous (+/−, lane 2), and homozygous (−/−, lane 3) ES cell cultures. Lanes 4–9: DNA from cocultured ES cells. An equal number (4 × 10⁵) of +/+ cells were cocultured with +/− cells in 33-mm dish (lanes 4, 6, and 8). Alternatively, an equal number of +/+ cells were cocultured with −/− cells (lanes 5, 7, and 9). DNA isolated from the indicated cultures were analyzed after one, two, or three passages. After EcoRV digestion, 23-kb and 8.5-kb bands, corresponding to the WT allele or the targeted allele (KO), respectively, could be detected by using an external probe. (C) Quantification of the amount of radioactivity in the hybridized restriction fragment corresponding to the WT allele (23 kb) or the Pten deletion allele (KO, 8.5 kb). The relative hybridization intensity of KO versus WT band in cocultures is presented. (D) ES cells (1 × 10⁵ cells/well in 24-well plate) were grown in media containing the indicated serum concentrations. Four days later, cells were counted. The relative cell growth was calculated by using cell numbers in 15% serum condition as 100%. Each value represents the average (±SD) obtained from a duplicate set of experiments. (E) WT (+/+, a), heterozygous (+/−, b) and two independent homozygous (−/−, c and d) ES cell lines were grown in serum-free medium for 4 days. Although no ES colonies, except the background feeder cell layers, were seen in the WT and heterozygous ES cultures (a and b, respectively), visible ES cell colonies (indicated by the arrowheads) were present in homozygous ES cultures (c and d). Scale bar: 200 μM.

