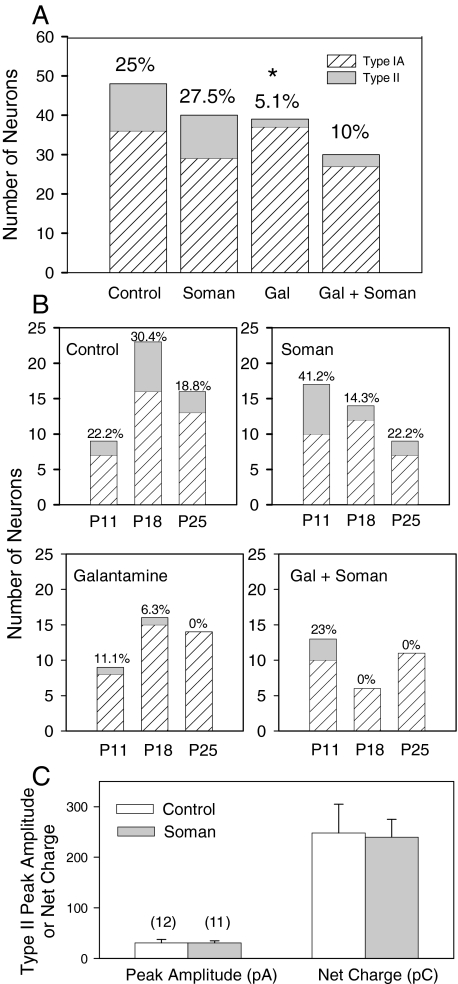
Fig. 10.
Effect of the acute treatments with galantamine and/or soman on the percentage of CA1 SRIs exhibiting type II currents in response to ACh. A, bar graph depicts the percentage of CA1 SRIs that respond to ACh (0.1 mM) with type IA or type II currents in various groups of animals. Ordinate, number of neurons showing type IA or type II currents. Note that all type II current neurons also had type IA currents. The percentage of neurons responding to ACh with type II currents in each group is shown at the top. Results obtained from P11 to P26 animals were grouped together. In each treatment group, results obtained from slices taken from the guinea pigs at 1, 7, and 14 days after that treatment were pooled together. The prevalence of type II currents in CA1 SRIs of galantamine-treated animals is significantly lower compared with control by Fisher's exact test (*, p = 0.017). B, results for each treatment group are categorized according to the age of the animals and the time after a given treatment. C, bar graph depicts the peak amplitude and net charge of type II currents recorded from SRIs of control and soman-challenged animals. Results from all age groups were pooled together. Graph and error bars are mean and S.E.M., respectively, of results obtained from various neurons. Numbers in parentheses represent the number of neurons studied in each experimental group.

