Fig. 5.
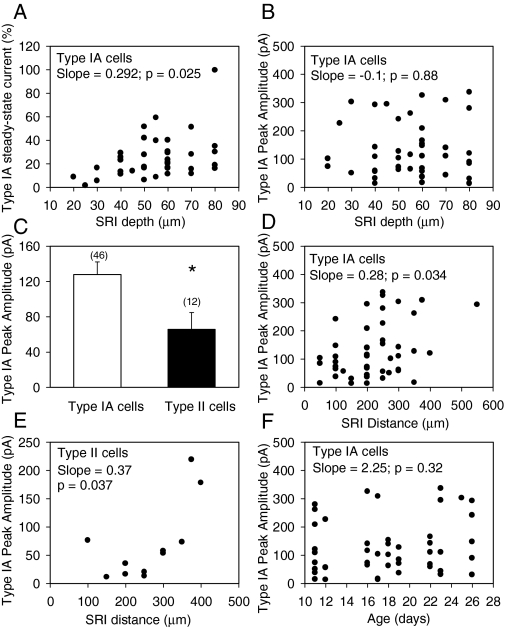
Physiological factors that influence the magnitude of SRI type IA currents. A, relationship between depth of SRIs from the slice surface and the magnitude of type IA steady-state current. The amplitude of type IA current remaining at 10 s after activating the solenoid valve for agonist delivery is expressed as percentage of the peak current and is shown in the ordinate. SRI depth shown on the abscissa represents the depth of the cell body from the surface of the slice, measured just before making the recordings. Each symbol represents a single neuron. A nonparametric linear regression of the data yielded a statistically significant positive slope. Type IA cells mentioned in all places represent those SRIs exhibiting only type IA currents. B, relationship between depth of SRIs from the slice surface and type IA current peak amplitude. A nonparametric linear regression of the data indicated no significant correlation between the two parameters. C, bar graph shows the peak amplitude of type IA currents in type IA neurons (neurons that exhibit only type IA currents) and in type II neurons (neurons with mixed responses). Numbers in parentheses represent the number of neurons studied. Graph and error bar are mean and S.E.M., respectively, of results obtained from 46 type IA cells and 12 type II cells. *, results are different with p = 0.038 (Student's t test). D and E, relationship between SRI distance from the pyramidal layer and type IA current peak amplitude in type IA (D) and type II (E) cells. The distance was measured from the midline of the pyramidal cell layer to the center of the SRI before making the recordings in the slices. In both cases, a nonparametric linear regression of the data revealed a statistically significant positive slope. F, relationship between the age of guinea pigs and type IA current peak amplitude.

