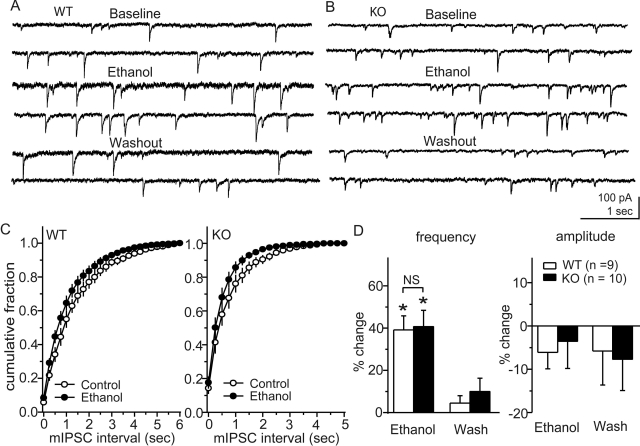
Fig. 5.
Ethanol effects on mIPSCs in CeA neurons from MOR KO and WT mice. A and B, representative mIPSCs before and during ethanol treatment and after washout of ethanol in CeA neurons from WT (A) and MOR KO (B) mice. C, cumulative plot of mIPSC frequencies before and during ethanol treatment from WT (left) and MOR KO (right) mice. In both groups, ethanol moved the cumulative frequency plot to the left by a comparable relative magnitude. D, averaged frequency and amplitudes, respectively, from WT mice (open columns) and MOR KO mice (closed columns). Ethanol increased the frequency of mIPSCs without significant changes in amplitude in both groups, suggesting increased vesicular GABA release in both cases; *, p < 0.05.

