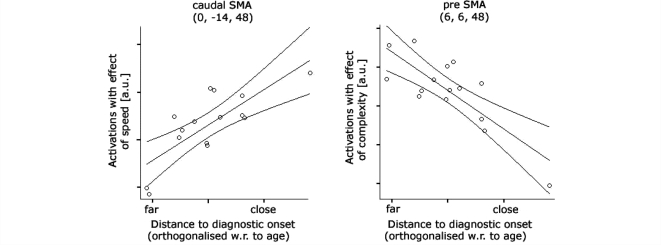
Figure 3.
Linear changes in activity in the caudal SMA and pre-SMA with the estimated years to diagnostic onset of Huntington's disease. Scatter plots illustrate peak correlations between estimated years to diagnostic onset and neuronal activations after controlling for linear age-effects. The fitted regression line is shown with 95% mean prediction interval.

