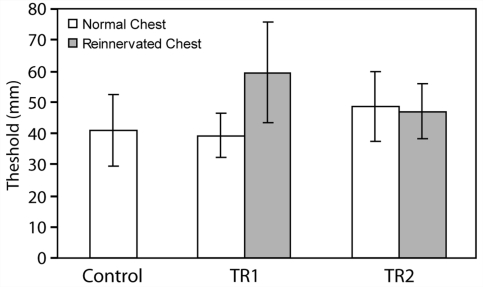
Figure 2.
Grating orientation thresholds in millimeters for the reinnervated (grey) and normal chest (white) for each targeted reinnervation amputee and the control population (white). There were 15 individuals in the control population. Error bars indicate 1 SD. This test employed a two-interval-forced-choice staircase routine to converge at a threshold value corresponding to 70.7% correct responses.

