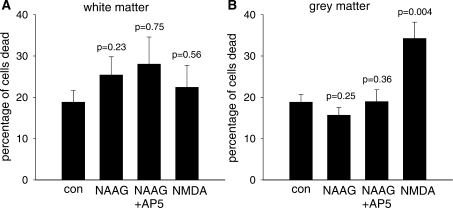
Figure 10.
The death of white matter (A) and grey matter (B) cells evoked by 1 mM NAAG (n = 11 slices), 1 mM NAAG and 100 µM AP5 (n = 6 slices) and 100 µM NMDA (n = 10 slices), compared with the death in control solution (n = 10 slices). Slices were incubated at 36°C for 6 h, and data were averaged from three replicate experiments. The percentage of death was calculated by dividing the number of dead cells (labelled with PI) by the total number of cells (given by the number of nuclei labelled with DAPI).

