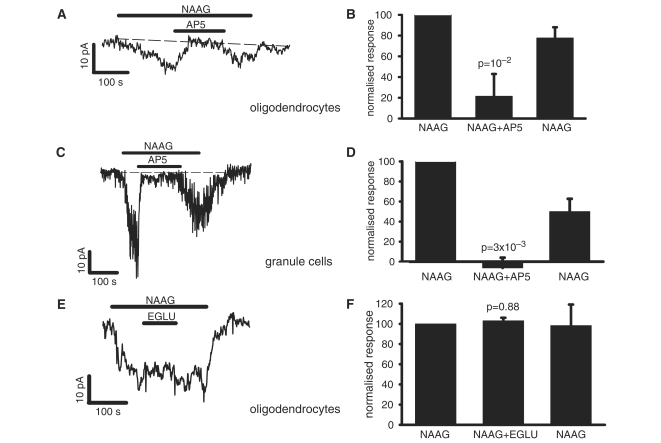
Figure 3.
Pharmacology of the NAAG-evoked current at –74 mV in white matter oligodendrocytes and cerebellar granule cells. (A) Representative trace shows response to 1 mM NAAG and block of the response by 100 µM AP5 in a white matter oligodendrocyte. (B) Mean effect on the response to 1 mM NAAG of 100 µM AP5 in 10 white matter oligodendrocytes. The second and third bars are normalized to the initial NAAG response (as 100%), and show the response to NAAG in the presence of AP5 and the response to a subsequent application of NAAG alone. P-value compares the response in NAAG to the average of the preceding and subsequent responses without AP5. (C) Representative trace shows response to 1 mM NAAG alone and block of the response by 100 µM AP5 in a granule cell. (D) Mean effect on the response to 1 mM NAAG of 100 µM AP5 in four granule cells. (E) Representative trace shows effect on 1 mM NAAG-evoked response of 200 µM EGLU in white matter oligodendrocyte. (F) Mean effect of 200 µM EGLU on the response to 1 mM NAAG in three white matter oligodendrocytes. Response in EGLU was measured at the end of EGLU application, and response to NAAG after EGLU was measured at the end of NAAG application.

