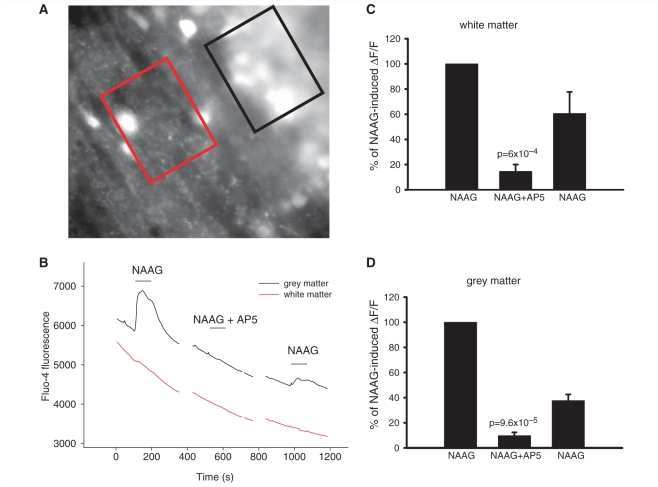
Figure 7.
Block of 1 mM NAAG-induced rise in [Ca2+]i in white and grey matter by 100 µM AP5. (A) Specimen image of cerebellar white matter (red region) and grey matter (black region) loaded with Fluo-4. (B) Block of NAAG-induced rise in Fluo-4 fluorescence in white matter and grey matter by AP5. (C) Average responses of white matter to NAAG, NAAG + AP5 and a subsequent application of NAAG (in four slices), normalized to the amplitude of the first response. (D) Normalized average responses of grey matter to NAAG, NAAG + AP5, and a subsequent application of NAAG (in four slices).

