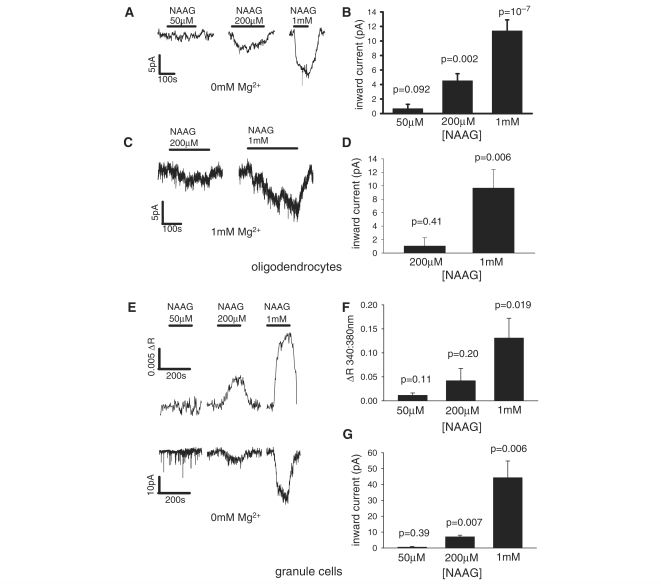
Figure 9.
The current response of white matter oligodendrocytes, and the current response and [Ca2+]i rise of grey matter granule cells, to pathologically relevant concentrations of NAAG. (A) Current responses of a single oligodendrocyte, and (B) mean response of 7, 9 and 25 cells, respectively to 50, 200 and 1000 µM NAAG in 0 mM Mg2+ solution. (C) Responses of a single oligodendrocyte and (D) mean response of 10 and 10 cells, respectively to 200 and 1000 µM NAAG in 1 mM Mg2+ solution with no added glycine. (E) [Ca2+]i rise (upper panel) and current response (lower panel) of a single granule cell, and mean (F) [Ca2+]i rise and (G) current response of three, four and seven cells to 50, 200 and 1000 µM NAAG in 0 mM Mg2+. All P-values are for comparison with zero response.

