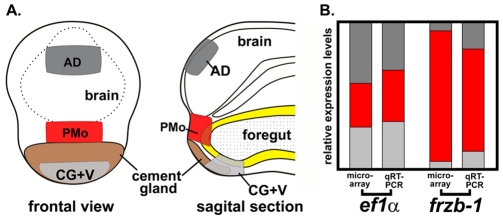
Fig. 1.
Schematic summarizing microarray screen for genes whose expression is enriched in the primary mouth anlage. (A) Regions microdissected for RNA collection: anterior dorsal region (AD, dark gray), ventral region including the cement gland (CG+V, light gray) and the presumptive primary mouth (PMo, red). Foregut epithelium is shown in yellow. (B) Expression of frzb-1 and ef1-alpha in the primary mouth (red) relative to flanking regions (88%, microarray; 71%, qRT-PCR).

