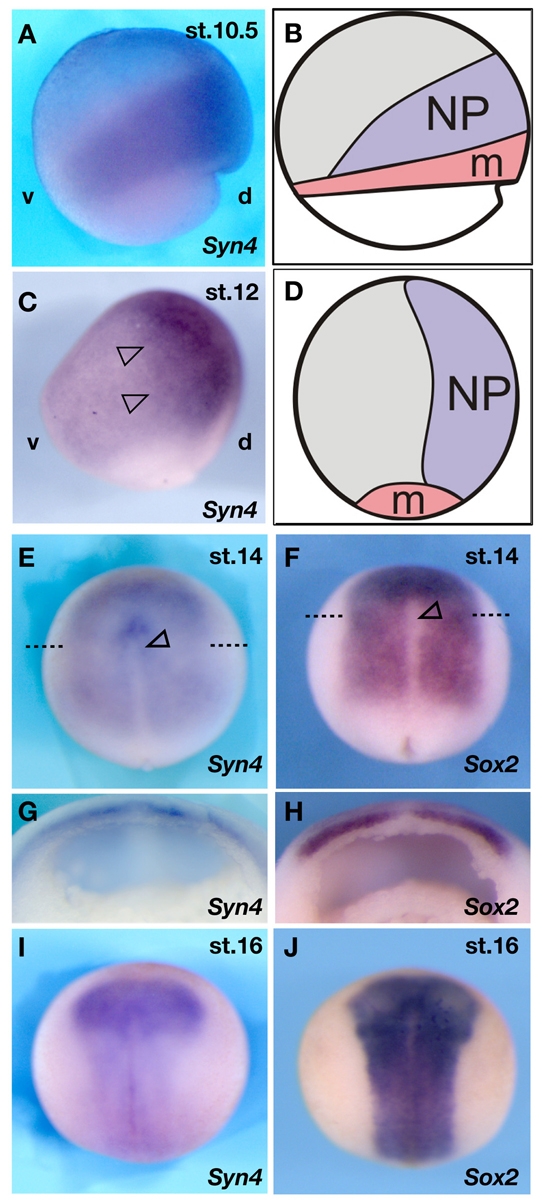
Fig. 1.

Dynamic expression of Syn4 in the neural plate region. Whole-mount in situ hybridisation analysis of Syn4 and Sox expression. (A) Lateral view of a stage 10.5 Xenopus embryo showing Syn4 expression in the dorsal marginal zone. Dorsal (d) to the right; ventral (v), left; animal pole to the top. (B) Fate map of a stage 10.5 embryo, shown in the same orientation as in A. NP, prospective neural plate; m, prospective mesoderm. (C) At stage 12, Syn4 expression (arrowheads) is restricted to the dorsal region of the embryo (orientation as in A). (D) Fate map of a stage 12 embryo, shown in the same orientation as in C. NP, neural plate. (E) At stage 14, Syn4 expression is seen in the neural plate, but is absent from the dorsal midline (arrowhead). Dashed line indicates the plane of the section in G. (F) Stage 14 embryo showing Sox2 expression. The expression pattern is similar to that of Syn4 in E. Dashed line indicates the plane of the section in H. Arrowhead, dorsal midline. (G) Section of a stage 14 embryo, showing Syn4 expression. No expression is observed at the midline or in mesoderm. (H) Section of a stage 14 embryo, showing Sox2 expression (I) At stage 16, Syn4 expression is seen in the neural plate. (J) Sox2 expression at stage 16.
