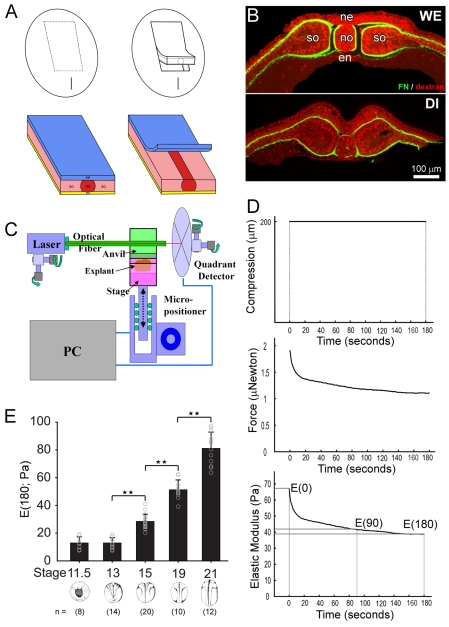
Fig. 1.
Dorsal isolates increase in stiffness with stage. (A) Schematic of microsurgery involved in making the dorsal isolate. The dorsal isolate contains neural ectoderm (ne), notochord (no), paraxial somitic mesoderm (so) and endoderm (en). Removal of the two-cell layered neural ectoderm reveals a distinct boundary between the notochord and paraxial mesoderm. (B) A microsurgically isolated dorsal isolate (DI) contains an identical configuration of tissues to dorsal tissues within a whole embryo (WE), shown with rhodamine-dextran (red) and fibrillar fibronectin matrix (green). Scale is the same for both panels. (C) The nanoNewton Force Measurement Device (nNFMD) measures resistive forces generated by the explant in response to compression by a computer controlled force-calibrated optical fiber. (D) Stiffness (defined at the Young's modulus after 180 seconds of unconstrained compression) is measured from a stress-relaxation protocol wherein the explant is compressed, a trace of the resistive force is measured, and a stiffness (Pa) is calculated. (E) Dorsal isolates were cut from a single clutch of embryos and their stiffness measured. Samples younger than stage 13 show little change in stiffness. However, stiffness increases sharply once the dorsal axis begins rapid elongation. The number of explants in each set is indicated in parentheses below the graph. Stars above pair-wise sets of explants indicate significant (one asterisk; P<0.05) and highly significant (two asterisks; P<0.01) differences.

