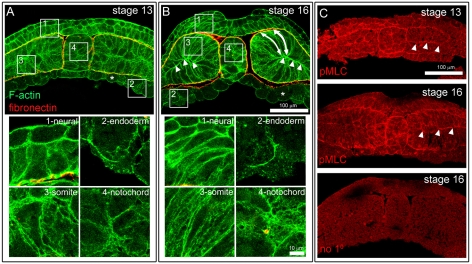
Fig. 7.
Differences in F-actin and pMLC density may underlie spatial differences in tissue stiffness. (A,B) Maximum projection images from representative embryos (projected from 20 sections at 0.5 μm intervals), show F-actin (green; bodipy-FL phallacidin) and fibronectin localization (red; mAb 4H2) across the dorsal region of embryos at stage 13 (A) and stage 16 (B). Neural, endoderm, pre-somitic mesoderm and notochord regions (labeled boxes) are shown at higher resolution in separate panels below. Cellular architecture at stage 16 within the pre-somitic mesoderm differs considerably from stage 13 with the formation of cell `buttresses' (double-headed arrows) and a pre-myocoel (arrowheads) in the stage 16 embryo. The endoderm in both stages have considerably less F-actin than adjacent tissues. Fibronectin staining was carried out to allow identification of overall tissue morphology. A and B are shown at the same scale. (C) Maximum projection images (from 10 sections at 0.5 μm intervals) show pMLC localizes to the interfaces between mesoderm, endoderm and neural ectoderm, as well as the interface between notochord and prospective somitic mesoderm in both stage 13 and stage 16 embryos. pMLC is strongly localized to the pre-myocoel interface between the dorsal and ventral leaflets of the somitic mesoderm and lateral plate (arrowheads) at stage 13 and 16. Samples in A-C were each from the same clutch of embryos fixed and processed in the same vial to allow direct comparison of either F-actin or pMLC levels. Non-specific background staining is shown in embryos processed without addition of primary antibody.

