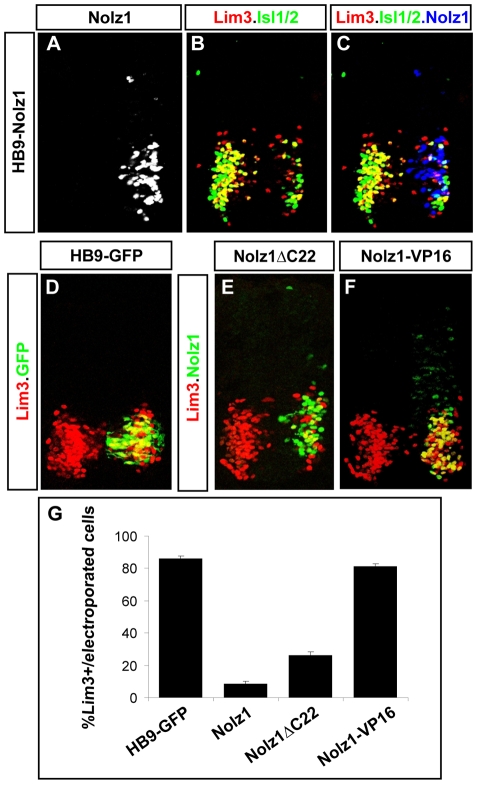
Fig. 5.
Nolz1 represses Lim3 expression in postmitotic MNs. (A-F) Confocal micrographs of St 21 chick spinal cord sections electroporated on the right. The high levels of Nolz1 elicited by overexpression preclude the detection of endogenous Nolz1 in the spinal cord under these imaging conditions. (G) Bar chart quantifying the percentage of electroporated cells expressing Lim3. n=10 embryos, mean ± s.e.m.

