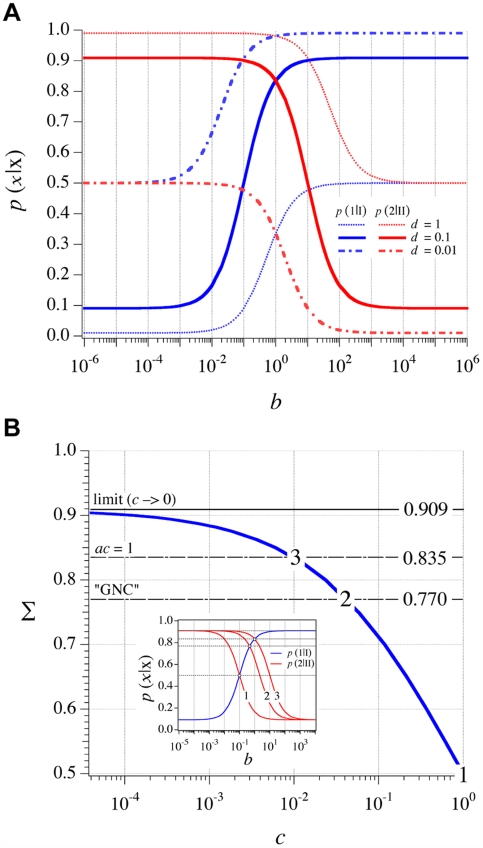
Figure 5. Regimes of the polymerization process.
(a) Effect of the value of the ratio k cat(1)/k −(I) on the polymerization process: p(1|I) and p(2|II) as a function of b for three significant values of d when a = 102 and c = 10−2. When d = 1, either homopolymerization of aa2 (b<1), or random polymerization (b≫1) are observed. When d = 0.1, a coding regime Σ = 0.835 is observed at the transition between two types of homopolymerization, which occurs at b = 1. When d = 0.01, either random polymerization (b≪1) or homopolymerization of aa1 (b>1) are observed. (b) Level of coding Σ as a function of c when a = 102 and d = 10−1. Three significant values of Σ are indicated. The inset shows a plot similar to (a) for three particular values of c (reported from the main graph).

