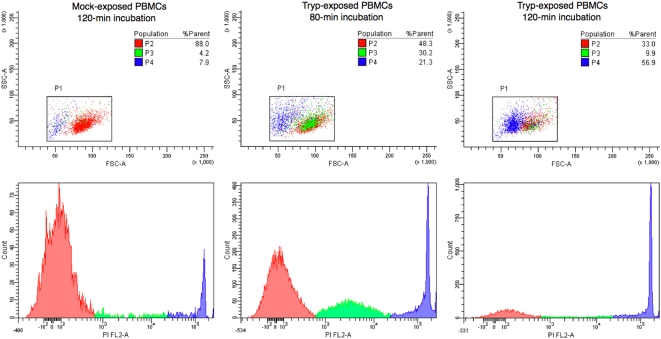
Figure 3. Exposure of mouse PBMCs to trypanosomes results in cell death.
Forward (FSC) and side (SSC) scatter dot plots (upper panels) and corresponding frequency distribution of PI incorporation among mock- and killed T. evansi-exposed PBMCs. P1 (red): annexinV/PI double-negative PBMCs; P2 (green): annexinV/PI double-positive cells with ∼intact FSC/SSC; and P3 (blue) annexinV/PI double-positive PBMCs with a skewed FSC profile suggesting size reduction. A stepwise process is obvious, with size preservation and moderate PI incorporation first, followed by marked PI incorporation and a drastic size reduction at a later stage. Relative population sizes are shown in the three top panels.

