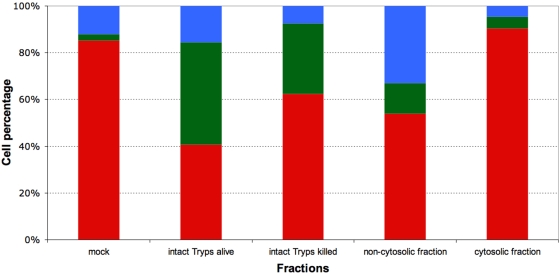
Figure 6. Effect of live trypanosomes, killed trypanosomes, and trypanosome fractions on lymphocyte survival.
Cells were exposed for 60 min to 4 108 trypanosomes per ml or to fractions corresponding to this concentration. The three cell subsets represented are normocytic and annexinV/PI double negative (red, healthy), normocytic and annexinV/PI double positive (green, early necrosis), and microcytic and annexinV/PI double positive (blue, late necrosis). Values presented are means of three independent experiments.

