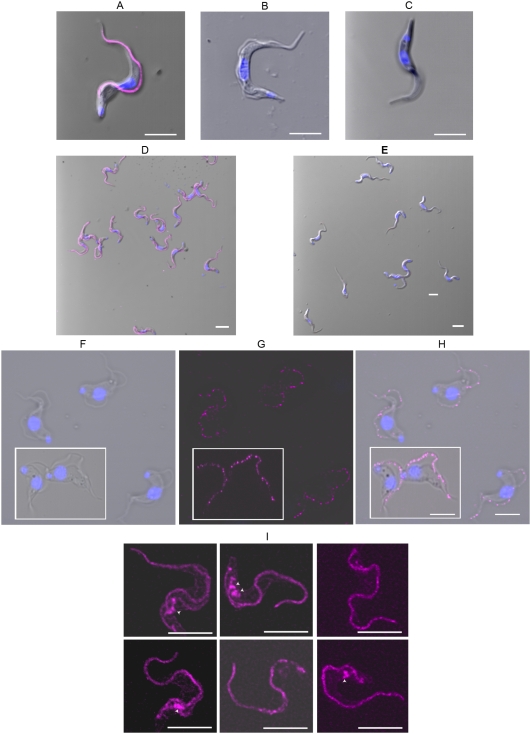
Figure 3. Confocal images of the GPI-PLC in GPI-PLC+/+, GPI-PLC−/−and procyclic form trypanosomes and the YFP-tagged GPI-PLC in recombinant bloodstream form cells.
Each of the panels, A–E, contains a merged image of the nucleus and kinetoplast, together with the GPI-PLC probed with anti-GPI-PLC antibody (magenta) and the phase image; (panel A), wild-type GPI-PLC+/+ bloodstream form trypanosome; (panel B), a GPI-PLC−/− null mutant bloodstream form trypanosome; (panel C), a wild-type procyclic form trypanosome; (panel D), a low power view of wild-type GPI-PLC+/+ bloodstream form trypanosomes and (panel E), a low power view of GPI-PLC−/− null mutant bloodstream form trypanosomes. The phase image (panel F) of S-42 stumpy bloodstream forms shows the typical morphology of these forms in this strain, while the fluorescence image (panel G) shows the location of the GPI-PLC (magenta) and the merge of these two images shows their spatial relationship (panel H). The location of YFP-tagged GPI-PLC is shown in the composite image of six bloodstream forms in panel I and the arrowheads point to the endo-membrane-bound spaces containing a small amount of GPI-PLC. Bars, 5 µm.

