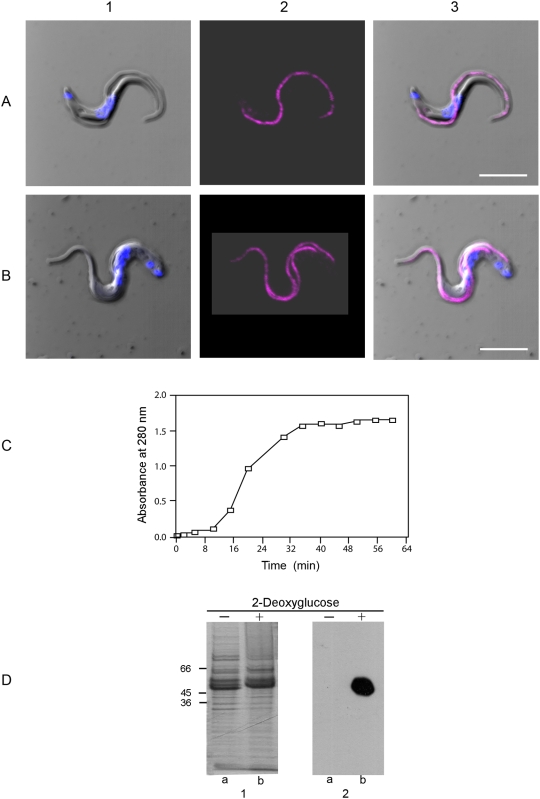
Figure 7. Location of the GPI-PLC in intact cells before and after release of the VSG.
Panel A shows a cell in a fully energized trypanosome incubated for 45 min at 37°C in the presence of glucose (10 mM). Panel B, shows a cell incubated for 45 min at 37°C without glucose but with 2-deoxyglucose (10 mM) added. In each case panel (1) is a merge of the DIC (gray) and Hoechst stained nucleus and kinetoplast (blue) images, panel (2) is the GPI-PLC image (magenta) and panel (3) is a merge of all images. Panel C shows the time course of the release of the VSG from bloodstream form trypanosomes in the absence of glucose but in the presence of 2-deoxyglucose measured as absorbance of the supernatant of cells at 280 nm. Panel D, image 1 shows the Coomassie blue stained proteins after SDS-PAGE of bloodstream form trypanosomes (MITat 1.1) incubated for 60 min in the presence of glucose (track a) and in the absence of glucose but with 2-deoxyglucose added (track b). Panel D, image 2 shows an equivalent western blot. Bars, 5 µm.

