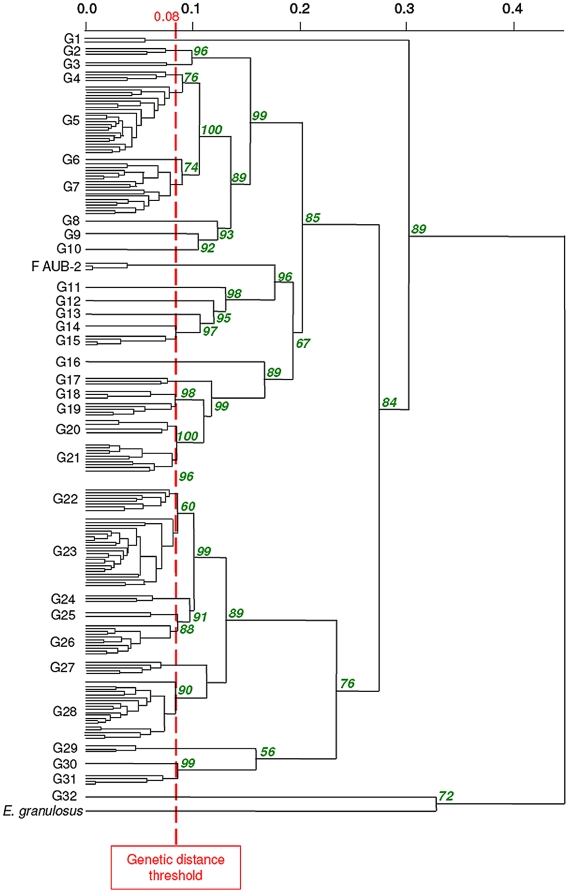
Figure 2. Dendrogram constructed from EmsB amplification data, achieved by hierarchical clustering analysis (Euclidean distance and unweighted pair group method).
Details of sample composition of the EmsB profiles G01 to G32 are given in Table 1. Approximately unbiased p-values are indicated in italics and in percent at each node of the tree, calculated with multiscale bootstrap (B = 1000). Worms from the same fox showing a genetic distance of less than 0.025 were pooled to simplify the dendrogram. F AUB-2: referring to three independent samples obtained from an E. multilocularis reference strains, maintained in vivo in Meriones unguiculatus during 7 months; these samples were taken to establish the genetic distance threshold of 0.08. An outgroup control is represented by E. granulosus sensu stricto (G1 strain, originating from an Algerian sheep [35]).

