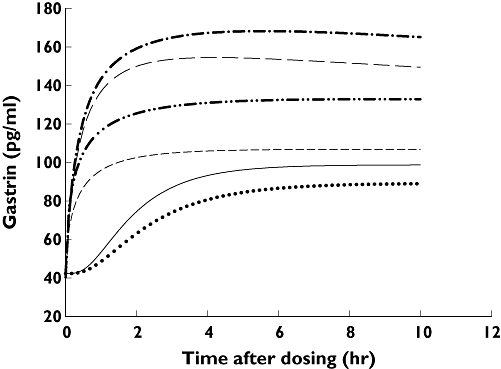
Figure 1.

Changes in the plasma gastrin concentration in CYP2C19 poor metabolizers and all extensive metabolizers on different days of rabeprazole treatment. The plots were generated from the pharmacokinetic–pharmacodynamic parameters predicted by nonmem. Day-1 EM ( ); Day-1 PM (
 ); Day-4 EM (
 ); Day-4 PM (
 ); Day-7 EM (
 ); Day-7 PM (
 )
)
