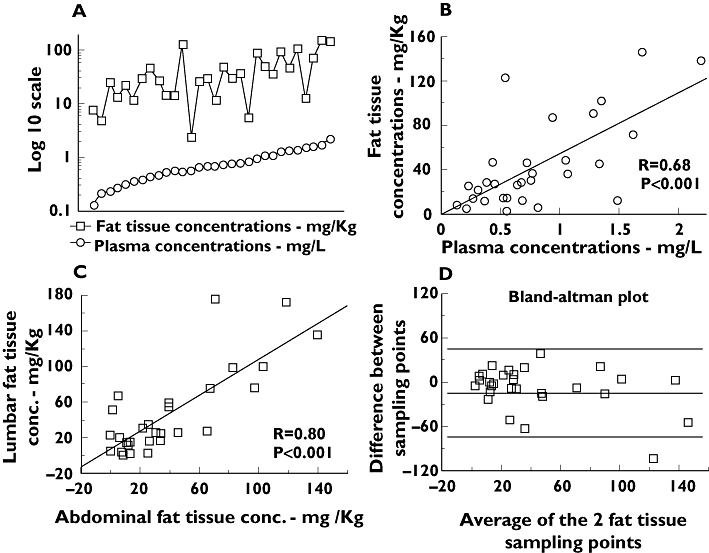
Figure 1.

Amiodarone concentrations in plasma and adipose tissue. Conc., concentrations. (a) Concentrations of amiodarone in adipose tissue and in plasma, in logarithmic scale, with observations ordered by plasma concentrations. (b) Linear regression of concentrations obtained in fat tissue with regard to concentrations in plasma. (c) Linear regression of concentrations obtained in the two simultaneous samples of adipose tissue performed. (d) Bland–Altman plot displaying the difference between measures at the two different sampling points of adipose tissue against its average, in mg kg−1. The limits of agreement are defined by the mean difference (medium line) +/− twice the standard deviation of the differences (top and bottom lines)
