Fig. 5.
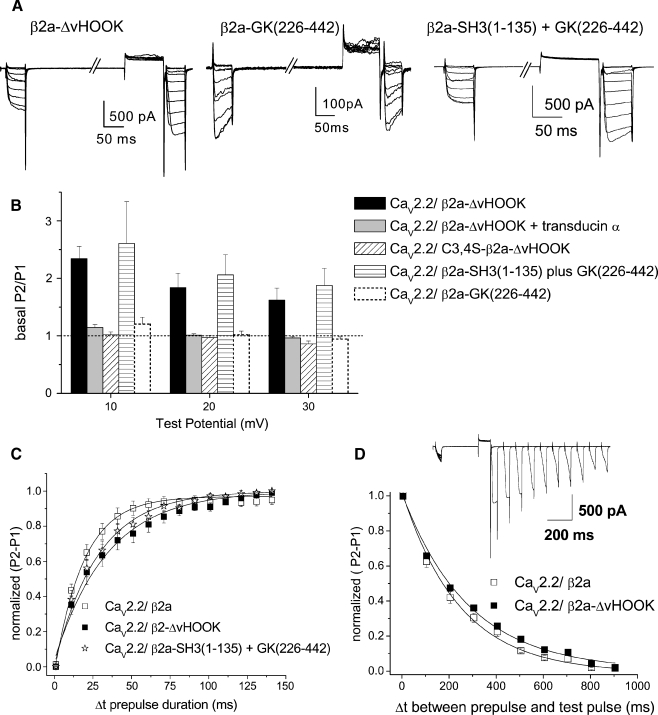
The determinants for basal facilitation in the presence of β2a constructs. a Example traces showing basal facilitation of CaV2.2 currents for CaV2.2/α2δ-2 coexpressed with β2a-ΔvHOOK (left), lack of basal facilitation with β2a-GK (226–442) (center), and basal facilitation with β2a-SH3 (1–135)+GK (226–442). Traces are shown for 40 ms depolarizations to +10 mV before and after a depolarizing prepulse to +100 mV. b Basal facilitation (P2/P1) ratio between +10 and +30 mV for CaV2.2/α2δ-2 coexpressed with β2a-ΔvHOOK (n = 9, black bars), β2a-ΔvHOOK+transducin-α (n = 7, gray bars), C3,4S-β2a-ΔvHOOK (n = 11, hatched bars), β2a-SH3 (1–135)+GK (226–442) (n = 9, horizontal striped bars), and β2a-GK (226–442) (n = 10, dashed bars, repeated from Fig. 3d for comparison). The dotted line indicates a P2/P1 ratio of 1, i.e., no basal facilitation. c Time course of facilitation with increasing prepulse duration Δt for β2a (open squares, n = 10), β2a-ΔvHOOK (filled squares, n = 10), and β2a-SH3 (1–135) and GK (226–442) (open stars, n = 9). The lines are single exponential fits to the mean data. d Time course of reinhibition with increasing duration Δt between prepulse and P2 test pulse for β2a (open squares, n = 6) and β2a-ΔvHOOK (filled squares, n = 6). The lines are single exponential fits to the mean data. The inset shows an example set of traces showing the increasing inhibition of the P2 traces with increased Δt

