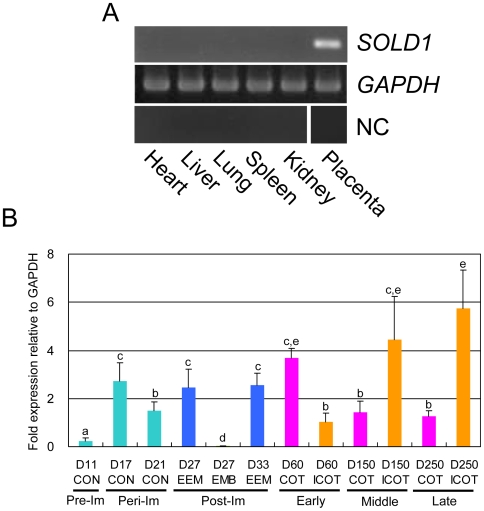
Figure 1. Expression of SOLD1 mRNA.
(A) Expression of SOLD1 mRNA in various bovine tissues, including heart, liver, lung, spleen, and kidney, was analyzed by RT-PCR. Cotyledonary tissue at Day 150 of gestation was used as a bovine placental sample. GAPDH expression in each tissue is presented as a positive control.CSH1 expression in each tissue except for the placenta is presented as a negative control (NC). ALB expression in the other tissue is presented as a negative control (NC).(B)Quantitative expression of SOLD1 in bovine placental tissues during the initial to rate stage of pregnancy by qRT-PCR analysis. Pre-Im, pre-implantaion; Peri-Im, peri-implantation; and Post-Im, post-implantation. CON, conceptus; EEM, extra-embryonic membrane; EMB, embryo; COT, cotyledon; and ICOT, intercotyledon. D, day after insemination. Expression of these mRNAs was normalized to the expression of GAPDH measured in the corresponding RNA preparation. Values are means±SEM. Values with different letters (a, b, c and d) are significantly different (P<0.05).

