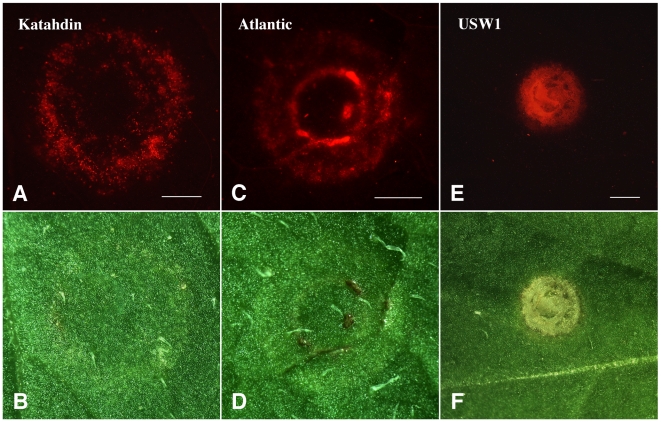
Figure 1. Red fluorescence derived from DsRED1 six days after agroinfiltration into potato leaves.
(A) Red fluorescence from a single infiltration site on Katahdin. (B) The same infiltration site as (A) under bright field. (C) Red fluorescence from a single infiltration site on Atlantic. (D) The same infiltration site as (C) under bright field. (E) Red fluorescence from a single infiltration site on USW1. No transgenic cells were detected on this image. The strong red fluorescence signals in this infiltration site were derived from autofluorescence associated with the necrotic tissue. (F) The same infiltration site as (E) under bright field. All bars are 10 mm.

