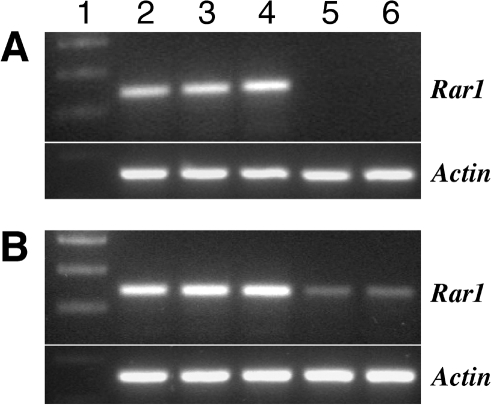
Figure 3. RT-PCR analysis of transient silencing of the potato Rar1 gene in two independent potato leaves (A and B).
Leaf samples around the infiltrated spots were collected at days 1, 2, 5 and 6 dpi. Lane 1: 100 bp DNA ladder marker; Lane 2: leaf sample from un-infiltrated control; Lane 3: leaf from infiltrated site 1 dpi; Lane 4: leaf from infiltrated site 2 dpi; Lane 5: leaf from infiltrated site 5 dpi; Lane 6: leaf from infiltrated site 6 dpi. Actin was amplified as a control for the amount of template. The amplified Rar1 and Actin transcripts are 339 bp and 360 bp, respectively.

