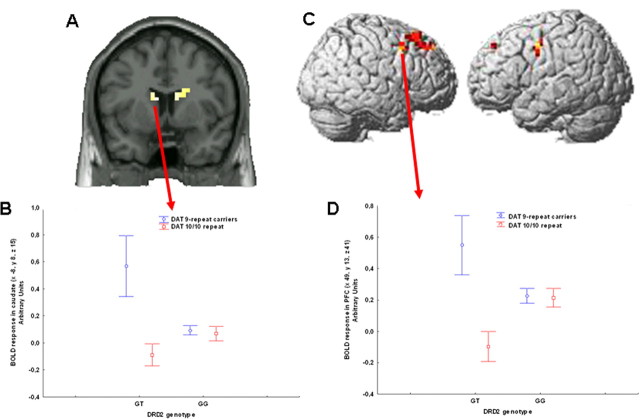
Figure 3.
A, Coronal MRI section through the caudate nuclei indicating locales with DRD2-DAT genotype interaction on BOLD response during encoding of recognition memory (image thresholded at p < 0.005, uncorrected); B, mean ± SE of BOLD response of the interaction between DRD2 and DAT genotypes. C, Three-dimensional rendering indicating the interaction between DRD2-DAT genotypes on cortical activity during encoding of recognition memory; D, mean ± SE of BOLD response of the interaction between DRD2-DAT genotype in right middle frontal gyrus activity during encoding of recognition memory.

