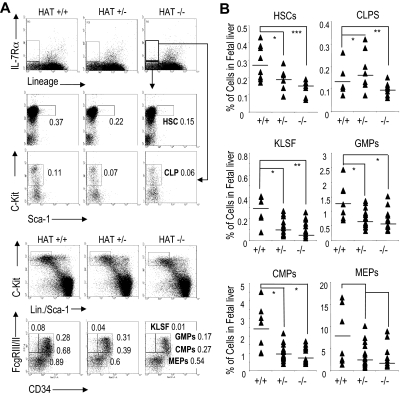
Figure 2.
Analyses of HSC and precursor populations in HAT+/+, HAT+/−, and HAT−/− fetal liver. (A) Staining and (B) quantification of E14.5 fetal liver cells with the indicated antibodies to identify the HSC, CLP, GMP, CMP, MEP, and KLSF populations by flow cytometry. To analyze the HSC and CLP populations, 8 HAT+/+, 8 HAT+/−, and 8 HAT−/− mice were used. To analyze the GMP, KLSF, CMP, and MEP populations, 8 HAT+/+ 24 HAT+/−, and 8 HAT−/− mice were used. The values represent the percentage of cells in each cell population. Each sample is represented by a ▴, and the average of the samples is presented as a horizontal bar. *P < .5; **P < .01; ***P < .005.

